Posted by James_McNulty
Calculating individual page speed performance metrics can help you to understand how efficiently your site is running as a whole. Since Google uses the speed of a site (frequently measured by and referred to as PageSpeed) as one of the signals used by its algorithm to rank pages, it’s important to have that insight down to the page level.
One of the pain points in website performance optimization, however, is the lack of ability to easily run page speed performance evaluations en masse. There are plenty of great tools like PageSpeed Insights or the Lighthouse Chrome plugin that can help you understand more about the performance of an individual page, but these tools are not readily configured to help you gather insights for multiple URLs — and running individual reports for hundreds or even thousands of pages isn’t exactly feasible or efficient.
In September 2018, I set out to find a way to gather sitewide performance metrics and ended up with a working solution. While this method resolved my initial problem, the setup process is rather complex and requires that you have access to a server.
Ultimately, it just wasn’t an efficient method. Furthermore, it was nearly impossible to easily share with others (especially those outside of UpBuild).
In November 2018, two months after I published this method, Google released version 5 of the PageSpeed Insights API. V5 now uses Lighthouse as its analysis engine and also incorporates field data provided by the Chrome User Experience Report (CrUX). In short, this version of the API now easily provides all of the data that is provided in the Chrome Lighthouse audits.
So I went back to the drawing board, and I’m happy to announce that there is now an easier, automated method to produce Lighthouse reports en masse using Google Sheets and Pagespeed Insights API v5.
Introducing the Automated PageSpeed Insights Report:
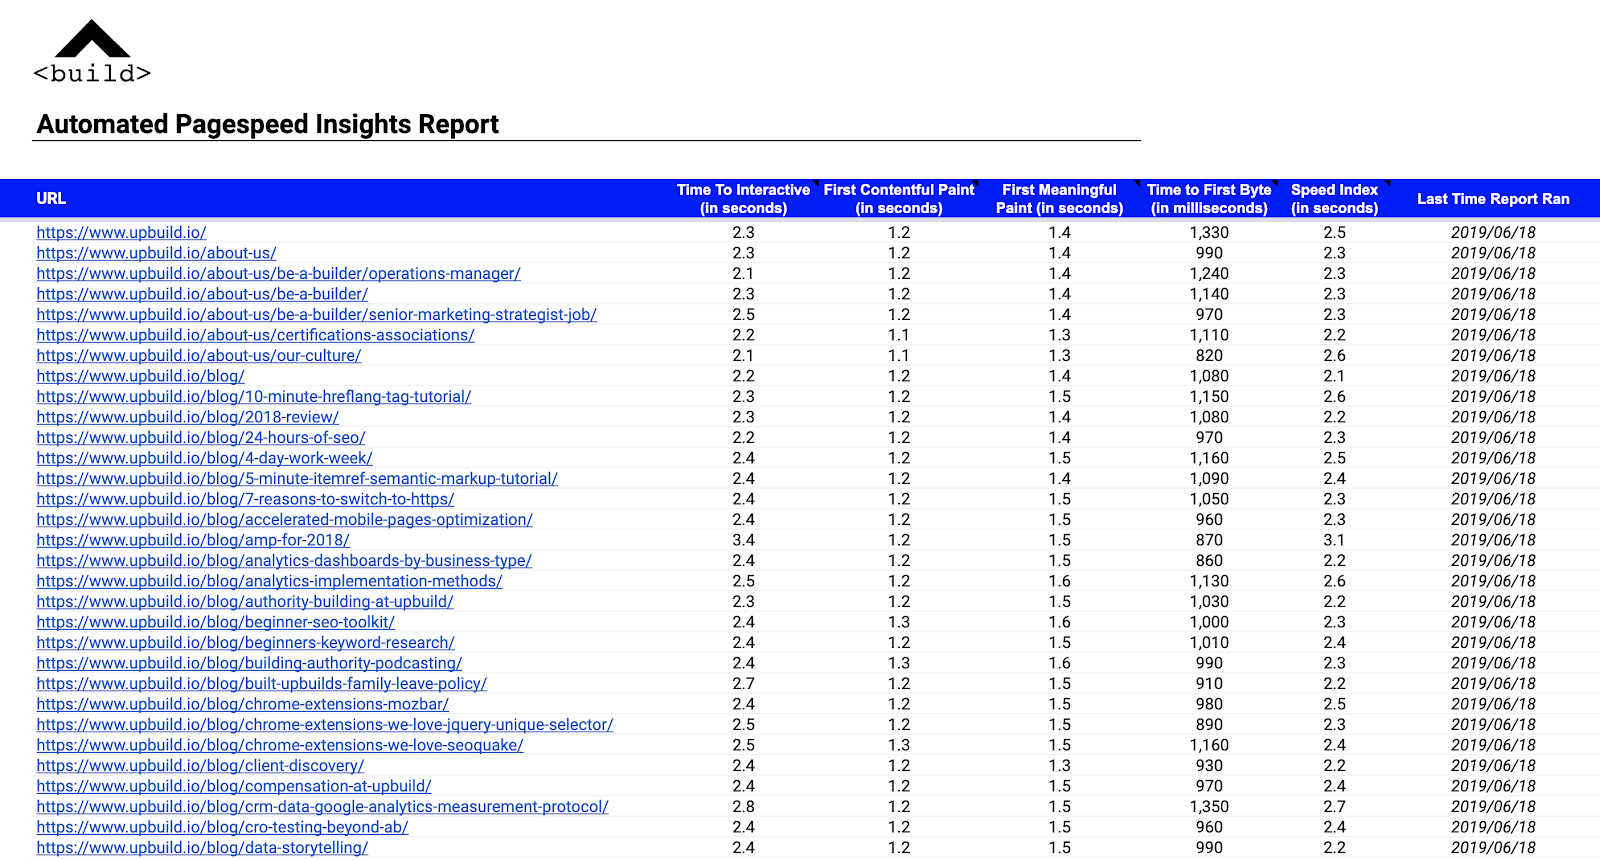
With this tool, we are able to quickly uncover key performance metrics for multiple URLs with just a couple of clicks.
All you’ll need is a copy of this Google Sheet, a free Google API key, and a list of URLs you want data for — but first, let’s take a quick tour.
How to use this tool
The Google Sheet consists of the three following tabs:
- Settings
- Results
- Log
Settings
On this tab, you will be required to provide a unique Google API key in order to make the sheet work.
Getting a Google API Key
- Visit the Google API Credentials page.
- Choose the API key option from the ‘Create credentials’ dropdown (as shown):
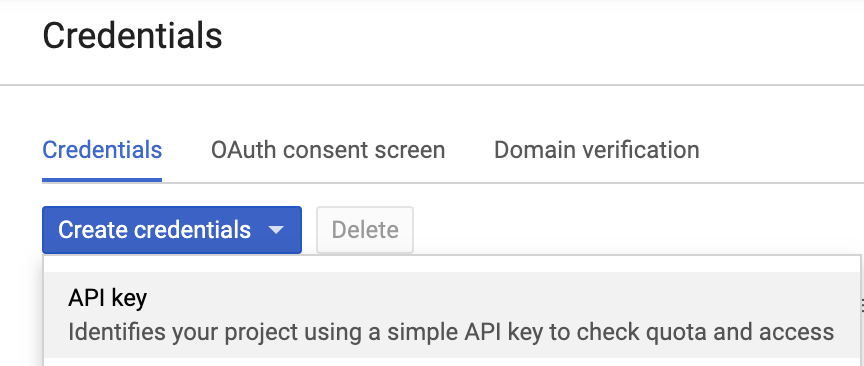
- You should now see a prompt providing you with a unique API key:
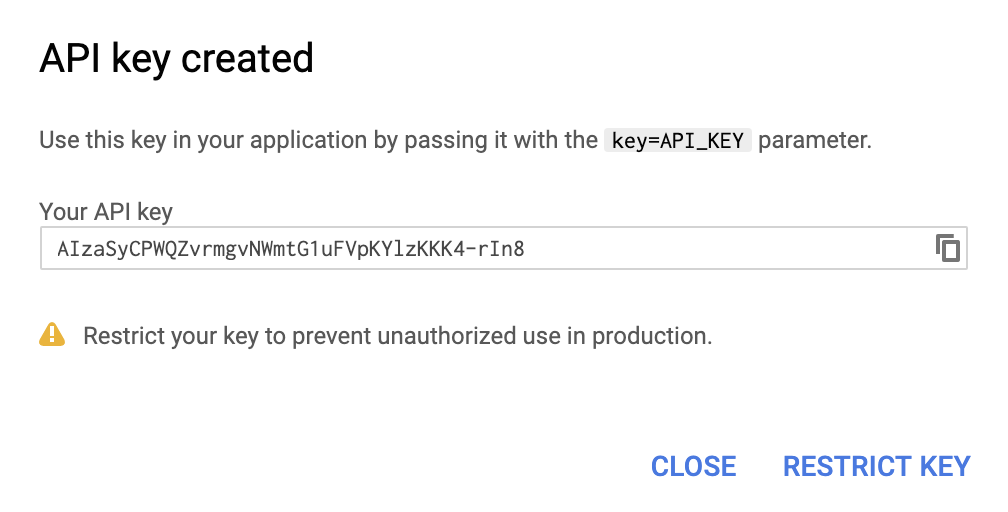
- Next, simply copy and paste that API key into the section shown below found on the “Settings” tab of the Automated Pagespeed Insights spreadsheet.

Now that you have an API key, you are ready to use the tool.
Setting the report schedule
On the Settings tab, you can schedule which day and time that the report should start running each week. As you can see from this screenshot below, we have set this report to begin every Wednesday at 8:00 am. This will be set to the local time as defined by your Google account.

As you can see this setting is also assigning the report to run for the following three hours on the same day. This is a workaround to the limitations set by both Google Apps Scripts and Google PageSpeed API.
Limitations
Our Google Sheet is using a Google Apps script to run all the magic behind the scenes. Each time that the report runs, Google Apps Scripts sets a six-minute execution time limit, (thirty minutes for G Suite Business / Enterprise / Education and Early Access users).
In six minutes you should be able to extract PageSpeed Insights for around 30 URLs.
Then you’ll be met with the following message:

In order to continue running the function for the rest of the URLs, we simply need to schedule the report to run again. That is why this setting will run the report again three more times in the consecutive hours, picking up exactly where it left off.
The next hurdle is the limitation set by Google Sheets itself.
If you’re doing the math, you’ll see that since we can only automate the report a total of four times — we theoretically will be only able to pull PageSpeed Insights data for around 120 URLs. That’s not ideal if you’re working with a site that has more than a few hundred pages!.
The schedule function in the Settings tab uses the Google Sheet’s built-in Triggers feature. This tells our Google Apps script to run the report automatically at a particular day and time. Unfortunately, using this feature more than four times causes the “Service using too much computer time for one day” message.
This means that our Google Apps Script has exceeded the total allowable execution time for one day. It most commonly occurs for scripts that run on a trigger, which have a lower daily limit than scripts executed manually.
Manually?
You betcha! If you have more than 120 URLs that you want to pull data for, then you can simply use the Manual Push Report button. It does exactly what you think.
Manual Push Report
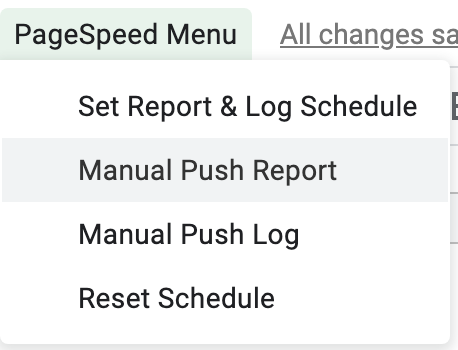
Once clicked, the ‘Manual Push Report’ button (linked from the PageSpeed Menu on the Google Sheet) will run the report. It will pick up right where it left off with data populating in the fields adjacent to your URLs in the Results tab.
For clarity, you don’t even need to schedule the report to run to use this document. Once you have your API key, all you need to do is add your URLs to the Results tab (starting in cell B6) and click ‘Manual Push Report’.
You will, of course, be met with the inevitable “Exceed maximum execution time” message after six minutes, but you can simply dismiss it, and click “Manual Push Report” again and again until you’re finished. It’s not fully automated, but it should allow you to gather the data you need relatively quickly.
Setting the log schedule
Another feature in the Settings tab is the Log Results function.
This will automatically take the data that has populated in the Results tab and move it to the Log sheet. Once it has copied over the results, it will automatically clear the populated data from the Results tab so that when the next scheduled report run time arrives, it can gather new data accordingly. Ideally, you would want to set the Log day and time after the scheduled report has run to ensure that it has time to capture and log all of the data.

You can also manually push data to the Log sheet using the ‘Manual Push Log’ button in the menu.
How to confirm and adjust the report and log schedules
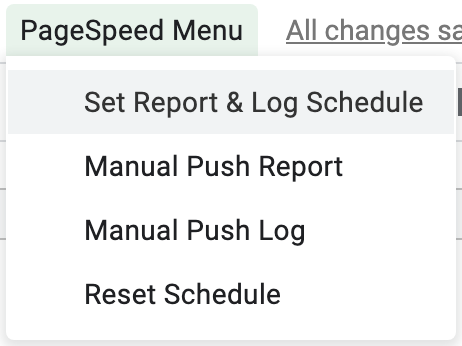
Once you’re happy with the scheduling for the report and the log, be sure to set it using the ‘Set Report and Log Schedule’ from the PageSpeed Menu (as shown):
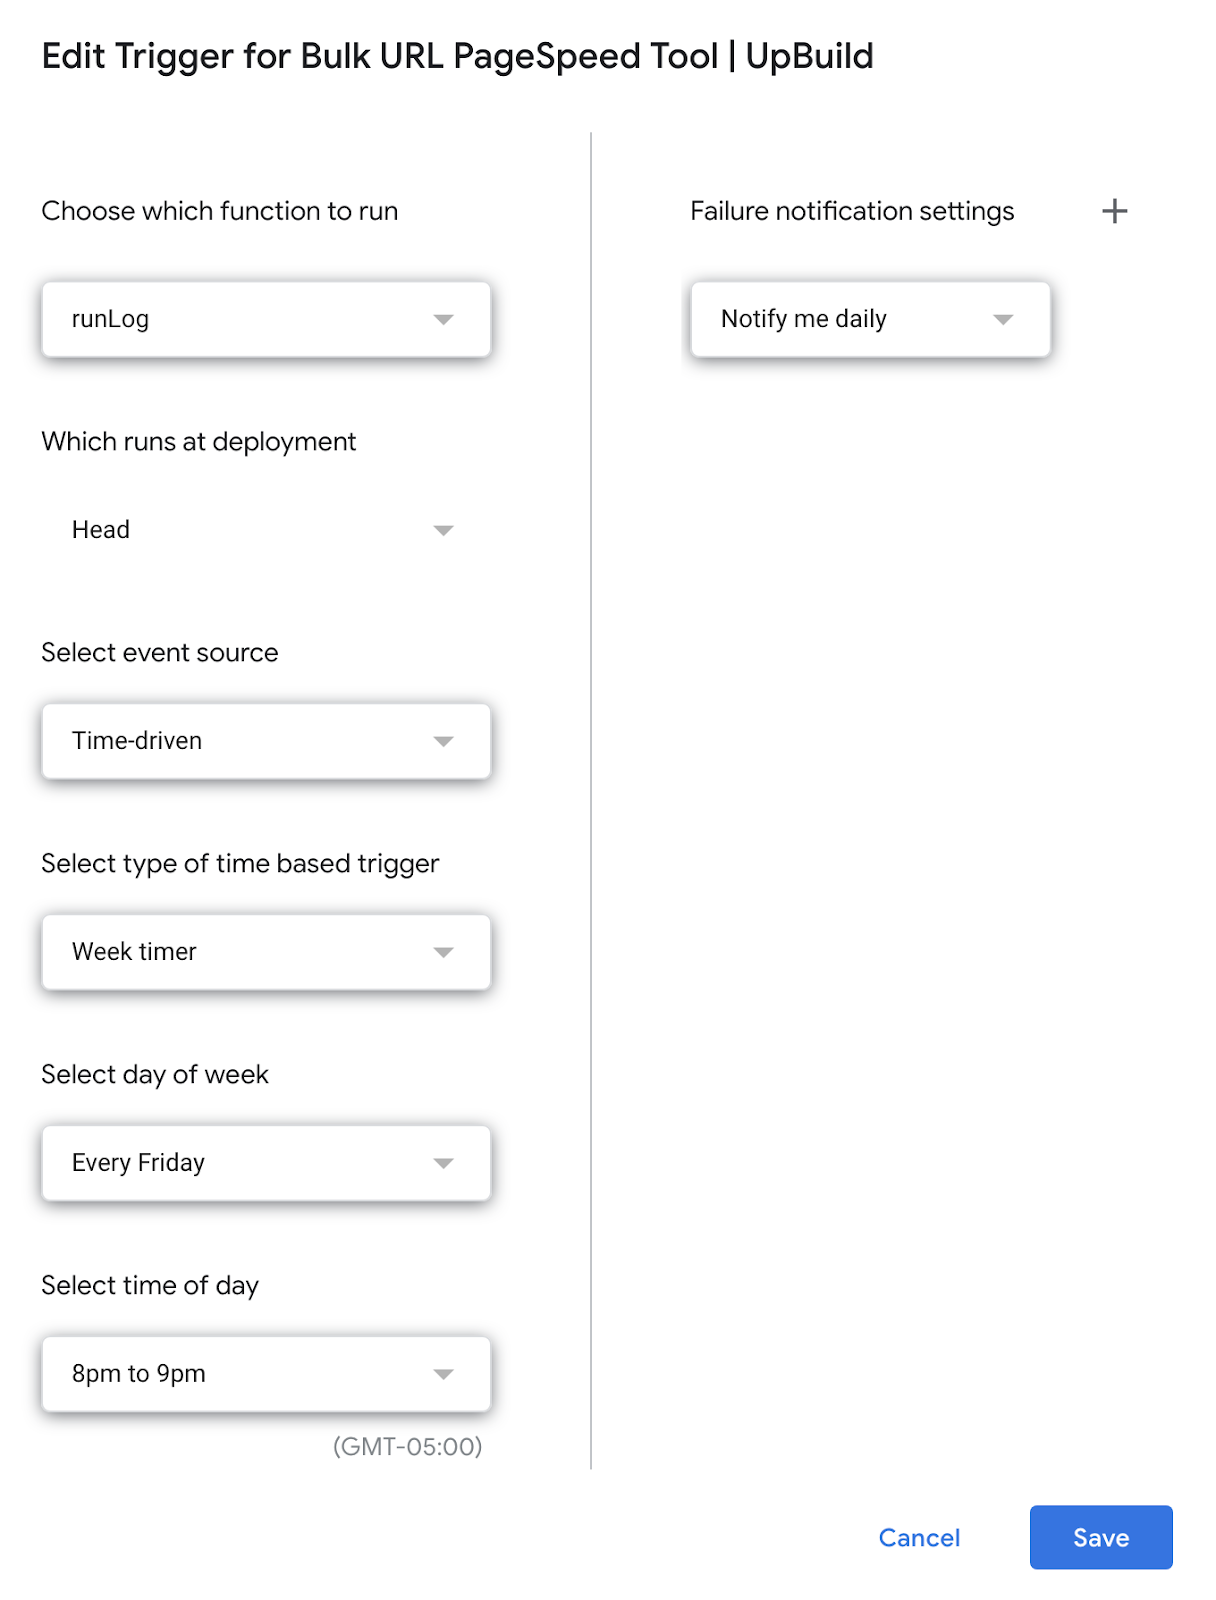
Should you want to change the frequency, I’d recommend first setting the report and log schedule using the sheet.
Then adjust the runLog and runTool functions using Google Script Triggers.
- runLog controls when the data will be sent to the LOG sheet.
- runTool controls when the API runs for each URL.
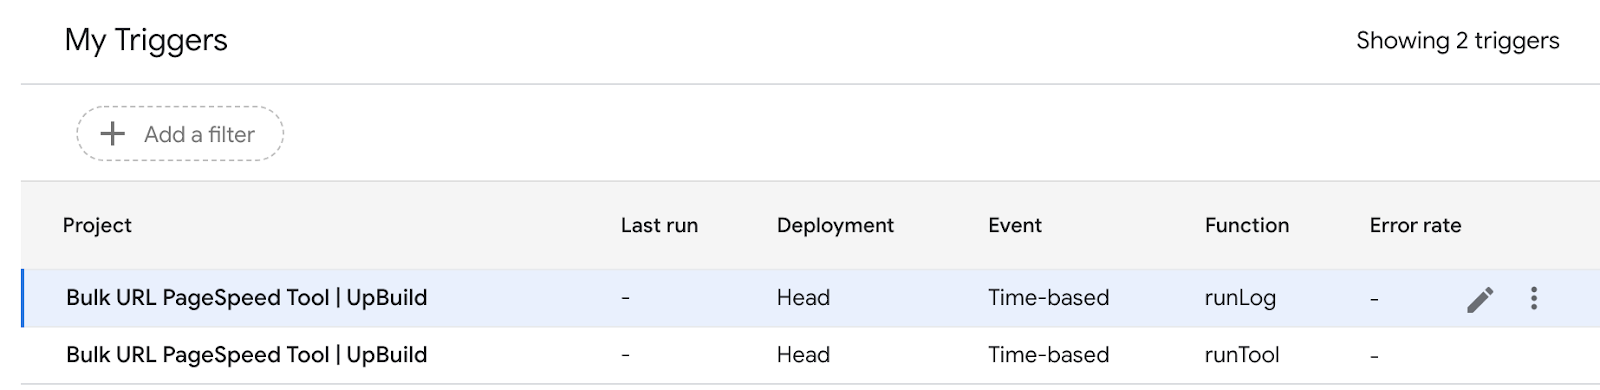
Simply click the pencil icon next to each respective function and adjust the timings as you see fit.
You can also use the ‘Reset Schedule’ button in the PageSpeed Menu (next to Help) to clear all scheduled triggers. This can be a helpful shortcut if you’re simply using the interface on the ‘Settings’ tab.
PageSpeed results tab
This tab is where the PageSpeed Insights data will be generated for each URL you provide. All you need to do is add a list of URLs starting from cell B6. You can either wait for your scheduled report time to arrive or use the ‘Manual Push Report’ button.
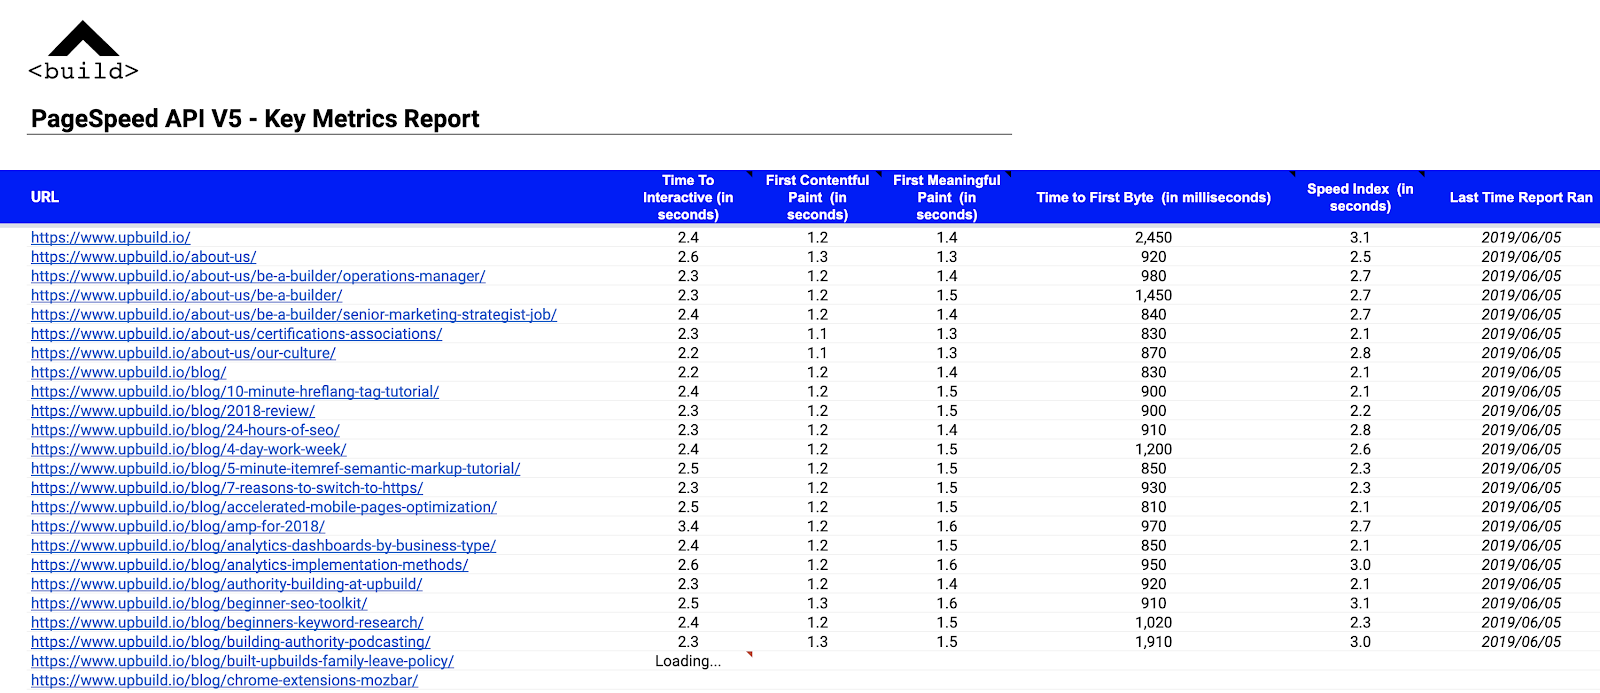
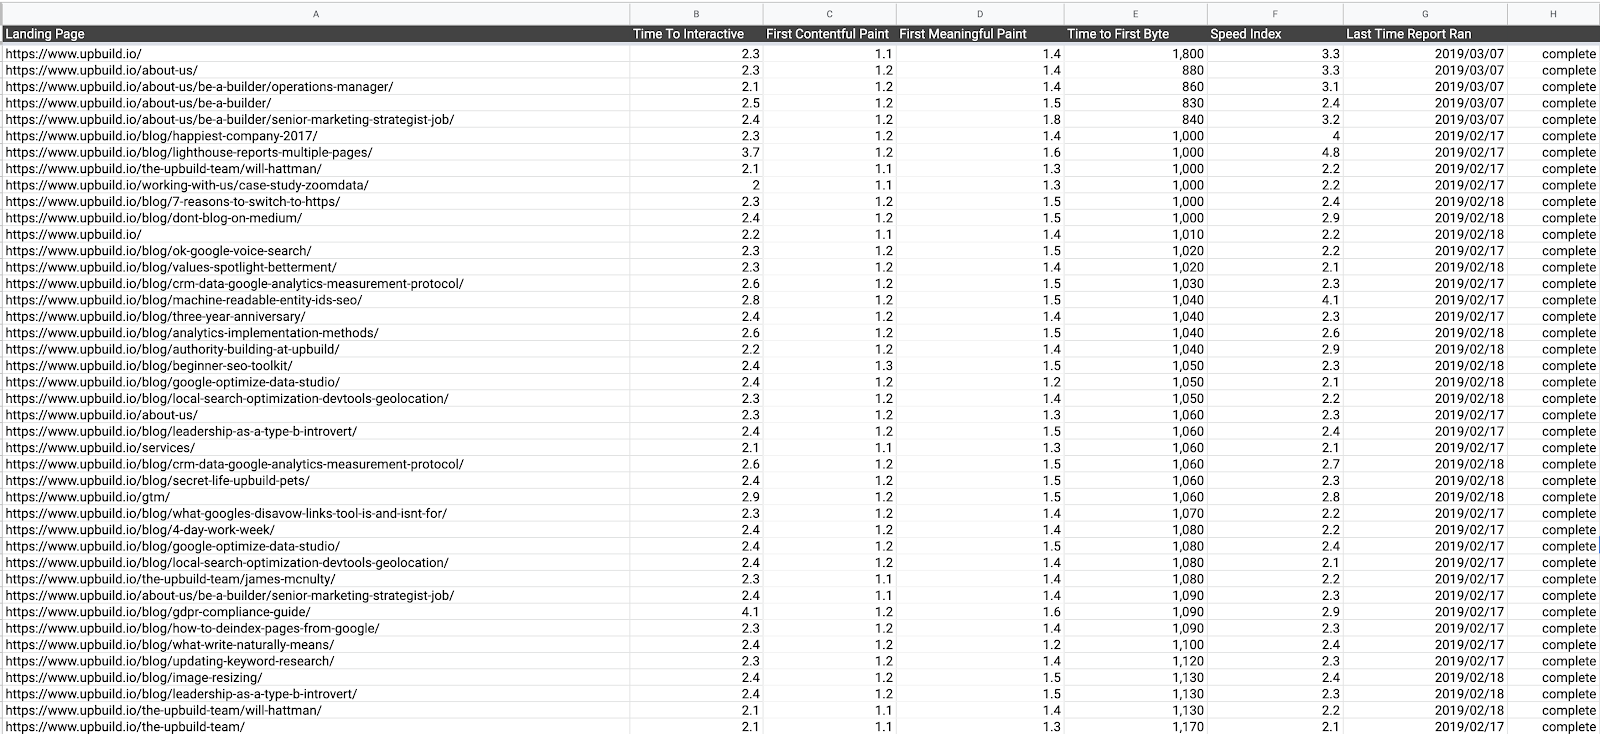
You should now see the following data generating for each respective URL:
- Time to Interactive
- First Contentful Paint
- First Meaningful Paint
- Time to First Byte
- Speed Index
You will also see a column for Last Time Report Ran and Status on this tab. This will tell you when the data was gathered, and if the pull request was successful. A successful API request will show a status of “complete” in the Status column.
Log tab
Logging the data is a useful way to keep a historical account on these important speed metrics. There is nothing to modify in this tab, however, you will want to ensure that there are plenty of empty rows. When the runLog function runs (which is controlled by the Log schedule you assign in the “Settings” tab, or via the Manual Push Log button in the menu), it will move all of the rows from the Results tab that contains a status of “complete”. If there are no empty rows available on the Log tab, it will simply not copy over any of the data. All you need to do is add several thousands of rows depending on how often you plan to check-in and maintain the Log.
How to use the log data
The scheduling feature in this tool has been designed to run on a weekly basis to allow you enough time to review the results, optimize, then monitor your efforts. If you love spreadsheets then you can stop right here, but if you’re more of a visual person, then read on.
Visualizing the results in Google Data Studio
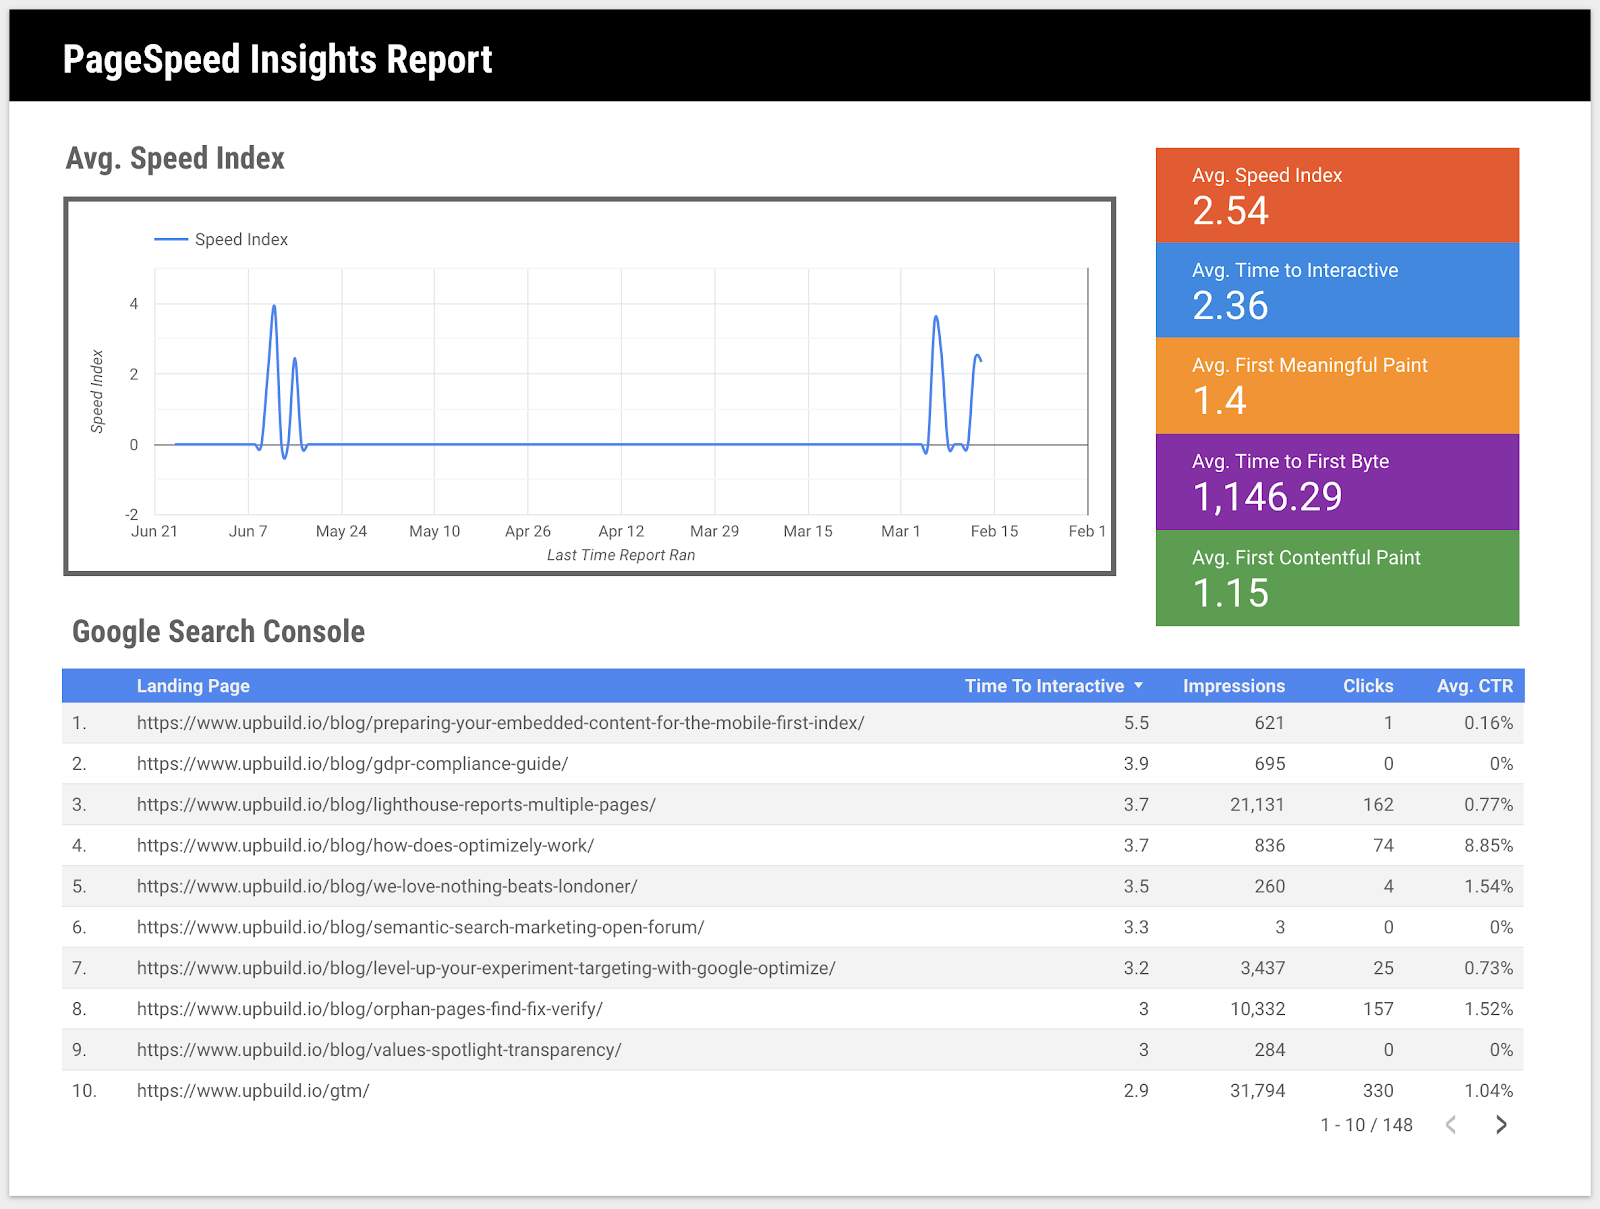
You can also use this Log sheet as a Data Source in Google Data Studio to visualize your results. As long as the Log sheet stays connected as a source, the results should automatically publish each week. This will allow you to work on performance optimization and evaluate results using Data Studio easily, as well as communicate performance issues and progress to clients who might not love spreadsheets as much as you do.
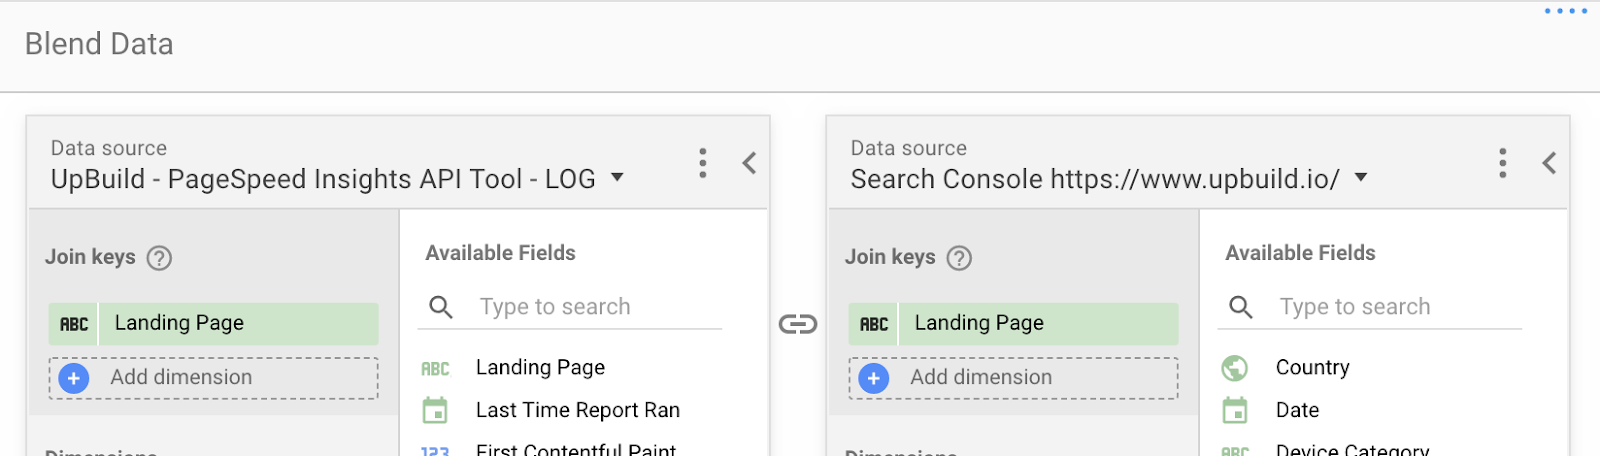
Blend your log data with other data sources
One great Google Data Studio feature is the ability to blend data. This allows you to compare and analyze data from multiple sources, as long as they have a common key. For example, if you wanted to blend the Time to Interactive results against Google Search Console data for those same URLs, you can easily do so. You will notice that the column in the Log tab containing the URLs is titled “Landing Page”. This is the same naming convention that Search Console uses and will allow Data Studio to connect the two sources.
There are several ways that you can use this data in Google Data Studio.
Compare your competitors’ performance
You don’t need to limit yourself to just your own URLs in this tool; you can use any set of URLs. This would be a great way to compare your competitor’s pages and even see if there are any clear indicators of speed affecting positions in Search results.
Improve usability
Don’t immediately assume that your content is the problem. Your visitors may not be leaving the page because they don’t find the content useful; it could be slow load times or other incompatibility issues that are driving visitors away. Compare bounce rates, time on site, and device type data alongside performance metrics to see if it could be a factor.
Increase organic visibility
Compare your performance data against Search ranking positions for your target keywords. Use a tool to gather your page positions, and fix performance issues for landing pages on page two or three of Google Search results to see if you can increase their prominence.
Final thoughts
This tool is all yours.
Make a copy and use it as is, or tear apart the Google Apps Script that makes this thing work and adapt it into something bigger and better (if you do, please let me know; I want to hear all about it).
Remember PageSpeed Insights API V5 now includes all of the same data that is provided in the Chrome Lighthouse audits, which means there are way more available details you can extract beyond the five metrics that this tool generates.
Hopefully, for now, this tool helps you gather Performance data a little more efficiently between now and when Google releases their recently announced Speed report for Search Console.
Sign up for The Moz Top 10, a semimonthly mailer updating you on the top ten hottest pieces of SEO news, tips, and rad links uncovered by the Moz team. Think of it as your exclusive digest of stuff you don’t have time to hunt down but want to read!
![]() The Moz Blog http://tracking.feedpress.it/link/9375/12829558
The Moz Blog http://tracking.feedpress.it/link/9375/12829558